
File:Greenland Albedo Change.png

本预览的尺寸:544 × 599像素。 其他分辨率:218 × 240像素 | 436 × 480像素 | 697 × 768像素 | 930 × 1,024像素 | 1,438 × 1,584像素。
原始文件 (1,438 × 1,584像素,文件大小:1.49 MB,MIME类型:image/png)
摘要
| 描述 |
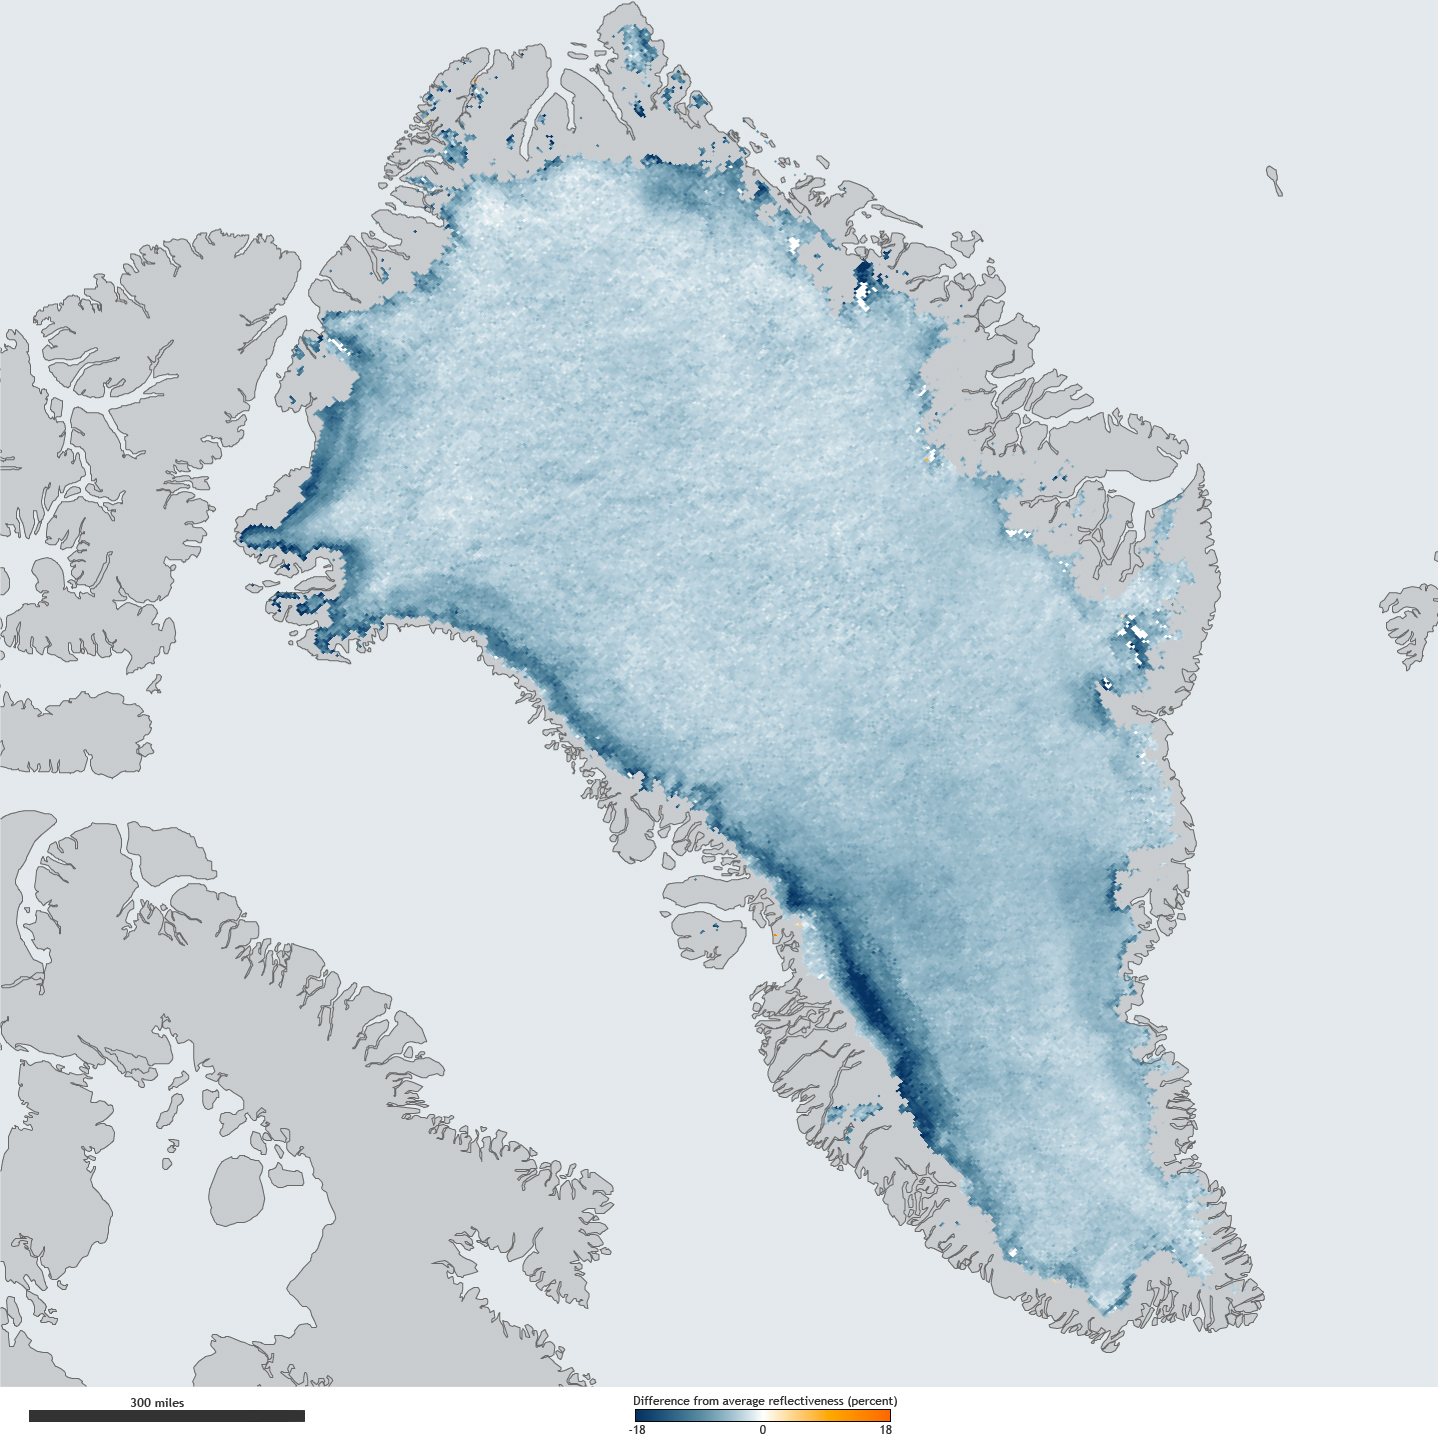
English: The map shows the difference between the amount of sunlight Greenland reflected in the summer of 2011 versus the average percent it reflected between 2000 to 2006. Virtually the entire ice sheet shows some change, with some areas reflecting close to 20 percent less light than a decade ago. The map is based on observations from the Moderate Resolution Imaging Spectroradiometer (MODIS) instruments on NASA’s Terra and Aqua satellites. It was produced as part of the National Oceanic and Atmospheric Administration’s Arctic Report Card. |
| 日期 | |
| 来源 | http://earthobservatory.nasa.gov/IOTD/view.php?id=76916 http://eoimages.gsfc.nasa.gov/images/imagerecords/76000/76916/greenlandalbedo_mod_2011_lrg.jpg |
| 作者 | Map by NOAA’s climate.gov team, based on NASA satellite data processed by Jason Box, Byrd Polar Research Center, the Ohio State University. Scanning electron microscope photos courtesy the Electron and Confocal Microscopy Laboratory, USDA Agricultural Research Service. |
许可协议
| 本文件完全由NASA创作,在美国属于公有领域。根据NASA的版权方针,NASA的材料除非另有声明否则不受版权保护。(参见Template:PD-USGov/zh、NASA版权方针页面或JPL图片使用方针。) | ||
 |
警告:
|
文件历史
点击某个日期/时间查看对应时刻的文件。
| 日期/时间 | 缩略图 | 大小 | 用户 | 备注 | |
|---|---|---|---|---|---|
| 当前 | 2012年2月12日 (日) 19:00 | | 1,438 × 1,584(1.49 MB) | Sagredo |
文件用途
以下页面使用本文件:
全域文件用途
以下其他wiki使用此文件:
- bn.wikipedia.org上的用途
- cs.wikipedia.org上的用途
- de.wikipedia.org上的用途
- en.wikipedia.org上的用途
- es.wikipedia.org上的用途
- eu.wikipedia.org上的用途
- fr.wikipedia.org上的用途
- ga.wikipedia.org上的用途
- id.wikipedia.org上的用途
- it.wikipedia.org上的用途
- nl.wikipedia.org上的用途
- no.wikipedia.org上的用途
- pl.wikipedia.org上的用途
- vi.wikipedia.org上的用途