
File:US timeline. Drugs involved in overdose deaths.jpg

本预览的尺寸:800 × 600像素。 其他分辨率:320 × 240像素 | 640 × 480像素 | 1,024 × 768像素 | 1,200 × 900像素。
原始文件 (1,200 × 900像素,文件大小:169 KB,MIME类型:image/jpeg)

|
File:US timeline - Drugs involved in overdose deaths.svg是此文件的矢量版本。 如果此文件质量不低于原点阵图,就应该将这个JPG格式文件替换为此文件。
File:US timeline. Drugs involved in overdose deaths.jpg → File:US timeline - Drugs involved in overdose deaths.svg
更多信息请参阅Help:SVG/zh。 |
 |
摘要
| 描述 |
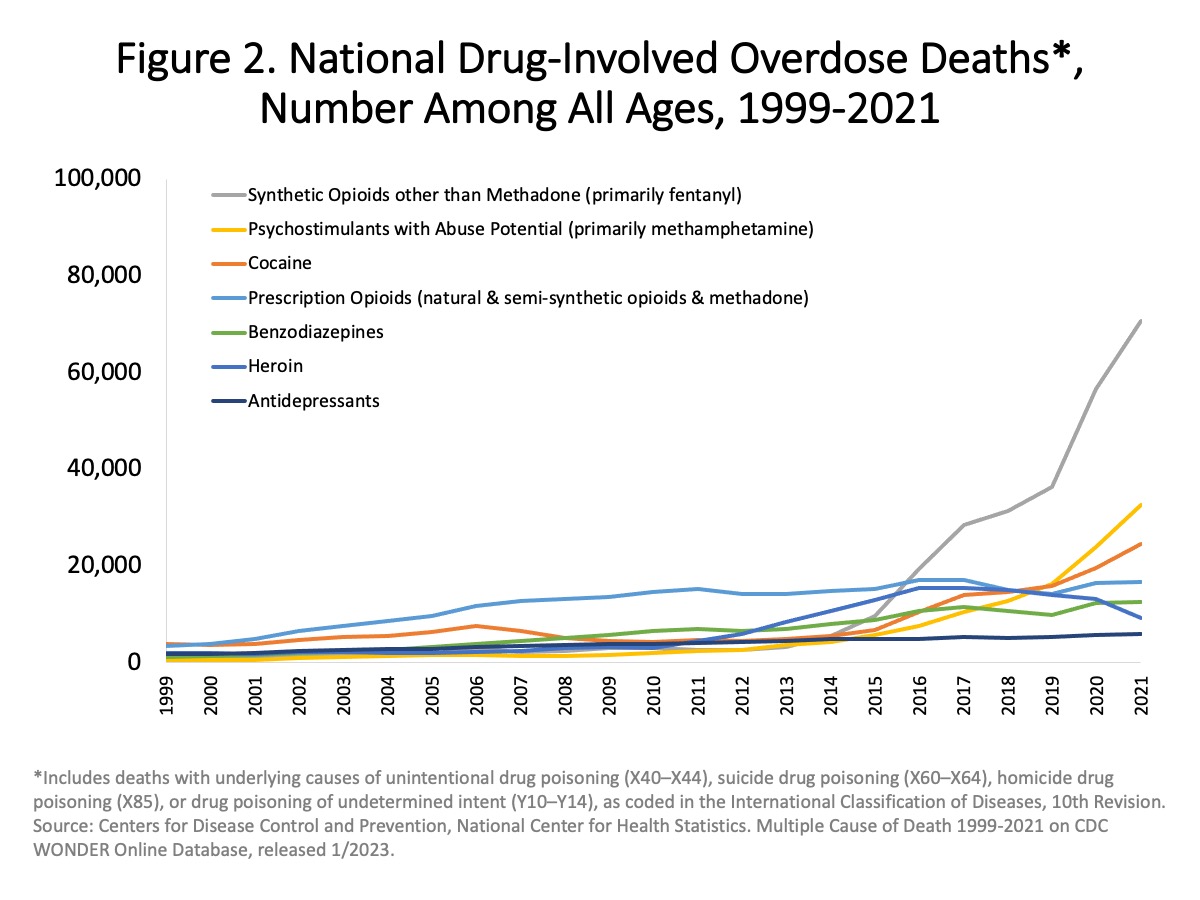
English: From source: "Figure 2. National Drug-Involved Overdose Deaths by Specific Category—Number Among All Ages, 1999-2021. Overall, drug overdose deaths rose from 2019 to 2021 with more than 106,000 drug overdose deaths reported in 2021. Deaths involving synthetic opioids other than methadone (primarily fentanyl) continued to rise with 70,601 overdose deaths reported in 2021. Those involving stimulants, including cocaine or psychostimulants with abuse potential (primarily methamphetamine), also continued to increase with 32,537 overdose deaths in 2021 (Source: CDC WONDER)." |
| 日期 | - date of first upload to the Commons. See file history for dates of later uploads. |
| 来源 | Overdose Death Rates. By National Institute on Drug Abuse (NIDA). See links section near the bottom of the page for the latest data link, and a PowerPoint link. See also CDC's searchable database, called CDC Wonder. 1999-2021 chart. 1999-2020 chart. 1999-2019 chart. 1999-2017 chart from PDF with larger version of chart. 1999-2017 provisional chart. 2000-2016 chart. |
| 作者 | National Institute on Drug Abuse. On some versions of the chart here on the Commons User:Timeshifter used freeware IrfanView to crop out the outer white space, edit text at the top, and add a border. See Commons:Convert tables and charts to wiki code or image files, and the section about adding and editing text on chart images. |
许可协议
這個圖像是美國衛生與公眾服務部下屬的美國國立衛生研究院的作品。作為美國聯邦政府的作品,這個圖像屬於公有領域。
 |
||
| 本文件已被确认为免除已知的著作权法限制(包括所有相关权利)。 | ||
文件历史
点击某个日期/时间查看对应时刻的文件。
| 日期/时间 | 缩略图 | 大小 | 用户 | 备注 | |
|---|---|---|---|---|---|
| 当前 | 2023年7月21日 (五) 23:37 | | 1,200 × 900(169 KB) | Jmabel | updated again |
| 2022年8月31日 (三) 00:26 |  | 1,200 × 900(141 KB) | Timeshifter | Latest at source. | |
| 2022年8月27日 (六) 22:34 |  | 3,259 × 2,420(611 KB) | YitzhakNat | 2020 update | |
| 2021年3月14日 (日) 14:58 |  | 1,183 × 562(158 KB) | Timeshifter | Latest version. | |
| 2019年8月16日 (五) 21:54 |  | 1,338 × 1,062(238 KB) | Timeshifter | Removed outer white space so that thumbnail views are more readable. Added "USA" to the top. Added border. | |
| 2019年4月26日 (五) 17:27 |  | 1,000 × 750(104 KB) | Natureium | Updated Jan 2019 | |
| 2018年9月11日 (二) 00:20 |  | 926 × 591(102 KB) | Timeshifter | Black border | |
| 2018年9月5日 (三) 18:51 |  | 935 × 610(100 KB) | Timeshifter | new version | |
| 2017年10月29日 (日) 19:49 |  | 800 × 482(44 KB) | Timeshifter | User created page with UploadWizard |
文件用途
以下页面使用本文件:
全域文件用途
以下其他wiki使用此文件:
- ar.wikipedia.org上的用途
- da.wikipedia.org上的用途
- de.wikipedia.org上的用途
- en.wikipedia.org上的用途
- Cocaine
- Substance abuse
- Fentanyl
- Drug overdose
- War on drugs
- Methamphetamine
- History of United States drug prohibition
- Talk:Opioid overdose
- Drugs in the United States
- Talk:Fentanyl/Archive 1
- Opioid epidemic in the United States
- Wikipedia:Reference desk/Archives/Science/2019 March 3
- Wikipedia:Reference desk/Archives/Science/2019 April 18
- User:Patrick.hunter001/sandbox
- User:Mr. Ibrahem/Opioid overdose
- es.wikipedia.org上的用途
- fi.wikipedia.org上的用途
- fi.wikinews.org上的用途
- gl.wikipedia.org上的用途
- hi.wikipedia.org上的用途
- hy.wikipedia.org上的用途
- it.wikipedia.org上的用途
- ja.wikipedia.org上的用途
- pt.wikipedia.org上的用途
- sl.wikipedia.org上的用途
- vi.wikipedia.org上的用途