File:Spectral views of zero-fill and interpolation by lowpass filtering.pdf

页面内容不支持其他语言。
這個文件來自維基共享資源
维基百科,自由的百科全书

原始文件(1,743 × 1,537像素,文件大小:101 KB,MIME类型:application/pdf


摘要

描述
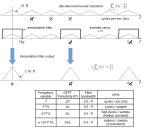
English: The first and third graphs depict the discrete-time Fourier transforms of a sampled function and the same function sampled 3 times faster. The second graph shows the transform of a sequence derived from the low-rate samples by inserting 2 zeros in-between each pair of real samples. It is identical to the first graph, except the numeral 3 is replaced by symbol L. A lowpass filter with bandwidth 0.5/T is also depicted. When applied to the zero-inserted sequence, its spectral output resembles the third graph, which is the desired result of interpolation. The maximum filter bandwidth is tabulated in the bandwidth units used by the common filter design applications.
日期
来源 自己的作品. The first and second graphs correspond to the first and third graphs of Harris[1], Figure 2.12, except the upsample rates are different (3 and 5)
作者 Bob K
授权
(二次使用本文件)
我,本作品著作权人,特此采用以下许可协议发表本作品:
Creative Commons CC-Zero 本作品采用知识共享CC0 1.0 通用公有领域贡献许可协议授权。
采用本宣告发表本作品的人,已在法律允许的范围内,通过在全世界放弃其对本作品拥有的著作权法规定的所有权利(包括所有相关权利),将本作品贡献至公有领域。您可以复制、修改、传播和表演本作品,将其用于商业目的,无需要求授权。

其他版本

此文件衍生的作品:  Spectral views of zero-fill and interpolation by lowpass filtering.svg

The current svg file renders the rectangular lowpass filter incorrectly. It should be a dashed line, not a solid line.

References
InfoField
  1. Harris, Frederic J. (2004年5月24日) "2.2" in 《 Multirate Signal Processing for Communication Systems》、​Upper Saddle River, NJ: Prentice Hall PTR、​第23頁 ISBN0131465112.

说明

添加一行文字以描述该文件所表现的内容

此文件中描述的项目

描繪內容

application/pdf

文件历史

点击某个日期/时间查看对应时刻的文件。

日期/时间缩⁠略⁠图大小用户备注
当前2024年3月25日 (一) 20:122024年3月25日 (一) 20:12版本的缩略图1,743 × 1,537(101 KB)Bob KRemove accidental (blank) second page.
2024年3月24日 (日) 23:082024年3月24日 (日) 23:08版本的缩略图1,743 × 1,537,2页(101 KB)Bob KChanged a label and a column header in the table.
2020年1月5日 (日) 15:222020年1月5日 (日) 15:22版本的缩略图1,743 × 1,537(69 KB)Bob Ksame frequency scale for all 3 graphs
2020年1月3日 (五) 15:502020年1月3日 (五) 15:50版本的缩略图1,743 × 1,537(67 KB)Bob Kminor improvements
2020年1月3日 (五) 02:512020年1月3日 (五) 02:51版本的缩略图1,743 × 1,537(67 KB)Bob Kmodify the table
2019年12月31日 (二) 02:512019年12月31日 (二) 02:51版本的缩略图1,743 × 1,289(54 KB)Bob Kreplace Z-transform graphs with table showing various units of bandwidth
2014年1月20日 (一) 23:492014年1月20日 (一) 23:49版本的缩略图1,800 × 1,425(36 KB)Bob KRemove accidental (blank) second page.
2014年1月20日 (一) 23:372014年1月20日 (一) 23:37版本的缩略图1,800 × 1,425,2页(37 KB)Bob KUser created page with UploadWizard

以下页面使用本文件:

全域文件用途

以下其他wiki使用此文件:

元数据